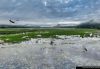
When great blue herons vanish from a marsh, scientists know something has gone wrong—often long before other warning signs appear. These patient fishers have become one of ecology’s most trusted sentinels.
The Bioindicator Effect: Reading Nature’s Signals
Great blue herons (Ardea herodias) occupy a unique position in wetland food webs. As apex predators that feed primarily on fish and amphibians, they concentrate everything happening below them in the ecosystem.
This makes them what scientists call bioindicators—species whose health reflects the condition of their entire habitat.
“Great blue herons are like the canary in the coal mine for wetland ecosystems,” explains Dr. Michael Erwin, wildlife biologist with the U.S. Geological Survey. “When heron populations decline, it signals problems that may take years to become obvious through other measures.”
The stability of wetlands depends on a delicate chain of interactions that maintain ecosystem balance across multiple trophic levels.
Why Herons Make Perfect Sentinels
Several characteristics make great blue herons especially valuable as environmental monitors:
Long lifespan: With individuals living 15-20 years in the wild, herons accumulate contaminants over time. This bioaccumulation makes them sensitive indicators of pollution.
High trophic position: As predators feeding on fish and amphibians, herons sit near the top of wetland food chains. Toxins concentrate at higher levels through biomagnification.
Site fidelity: Herons return to the same rookeries year after year. Scientists can monitor consistent locations over decades.
Visible nesting colonies: Rookeries are easy to locate and census, providing reliable population data.
Diverse habitat use: Herons inhabit freshwater, brackish, and saltwater wetlands across vast geographic ranges, allowing comparisons across ecosystem types.
According to the National Audubon Society, great blue heron populations reflect water quality, prey abundance, and overall wetland integrity more reliably than many other monitoring methods.
Why Great Blue Herons Are Ideal Bioindicators
| Characteristic | Bioindicator Value |
| Lifespan | 15-20 years allows long-term contaminant accumulation |
| Trophic Level | Top predator position concentrates toxins via biomagnification |
| Site Fidelity | Returns to same rookeries enabling multi-decade monitoring |
| Colony Visibility | Easy to locate and census for population tracking |
| Habitat Range | Uses diverse wetland types across North America |
| Reproductive Monitoring | Nest success reveals contamination and habitat quality |
| Cost-Effectiveness | Single species tracks multiple environmental parameters |
What Heron Health Reveals About Wetlands
Changes in great blue heron populations and reproductive success telegraph specific environmental problems.
Population Declines: The First Red Flag
When heron numbers drop at a rookery, biologists investigate several potential causes:
Prey depletion: Overfishing, habitat degradation, or drought can reduce fish populations below levels needed to support heron colonies.
Water quality degradation: Pollution, excessive nutrients (eutrophication), or oxygen depletion kills prey species and forces herons elsewhere.
Habitat loss: Wetland drainage, shoreline development, or vegetation changes eliminate feeding territories.
Human disturbance: Increased boat traffic, development near rookeries, or recreational pressure can cause colony abandonment.
A study published in Waterbirds documented that rookeries abandoned by great blue herons showed measurable declines in water quality within 2-3 years before abandonment—proving herons detected problems before conventional monitoring did.
Reproductive Failure: The Chemical Warning
Perhaps the most valuable information comes from monitoring heron breeding success. Changes in egg production, hatching rates, and chick survival reveal contamination issues.
Mercury contamination: Research from the Smithsonian Environmental Research Center shows that herons with blood mercury levels above 3.0 parts per million (ppm) experience reduced reproductive success. Eggs fail to hatch, or chicks develop neurological problems.
Pesticide exposure: Organophosphates and other agricultural chemicals accumulate in fish, then concentrate in herons. Affected birds produce thin-shelled eggs that break during incubation or exhibit abnormal parental behavior.
PCB and dioxin contamination: These persistent organic pollutants cause hormonal disruption, leading to abnormal chick development and reduced immune function.
Heavy metals: Lead, cadmium, and selenium from industrial pollution accumulate in heron tissues, impairing reproduction even when adult birds appear healthy.
Dr. Barnett Rattner, wildlife toxicologist at the U.S. Geological Survey, notes: “Monitoring contaminant loads in great blue heron eggs gives us an integrated measure of wetland contamination. The herons do the sampling for us.”
Mercury Contamination Thresholds in Great Blue Herons
| Mercury Level (ppm) | Health Status | Observable Effects |
| <1.0 ppm | Safe range | No measurable impacts on reproduction or survival |
| 1.0-3.0 ppm | Moderate contamination | Potential sublethal effects; slightly reduced reproductive success |
| 3.0-5.0 ppm | High contamination | Reproductive impairment; reduced hatching rates; chick abnormalities |
| >5.0 ppm | Severe toxicity | Major reproductive failure; neurological damage; adult mortality risk |
Physical Deformities: Visible Pollution Signals
In severely contaminated wetlands, heron chicks sometimes exhibit physical abnormalities:
- Crossed bills (bill deformities preventing proper feeding)
- Skeletal malformations (twisted legs or wings)
- Impaired feather development
- Unusual growth rates (either stunted or abnormally rapid)
These “gross deformities” indicate acute toxicity levels threatening the entire ecosystem.
Heron Population Health Across Habitat Types
North American Wetland Comparison
Healthy Freshwater Wetlands
- Nests per hectare: 15-25
- Fledged young per nest: 2-3
- Adult annual survival: 75-85%
- Mercury levels: <1.0 ppm
- Primary threats: Minimal
Degraded Agricultural Wetlands
- Nests per hectare: 5-12
- Fledged young per nest: 1-2
- Adult annual survival: 60-70%
- Mercury levels: 1.0-3.0 ppm
- Primary threats: Pesticide runoff, nutrient pollution
Polluted Industrial Wetlands
- Nests per hectare: 0-5 (frequent abandonment)
- Fledged young per nest: 0-1
- Adult annual survival: <60%
- Mercury levels: >3.0 ppm
- Primary threats: Heavy metals, PCBs, legacy contamination
Coastal Estuaries
- Nests per hectare: 10-20
- Fledged young per nest: 2-3
- Adult annual survival: 70-80%
- Mercury levels: Variable (1.0-2.5 ppm)
- Primary threats: Coastal development, storm impacts
Detailed Habitat Quality Indicators
| Habitat Type | Density | Reproduction | Survival | Contaminants | Status |
| Healthy Freshwater | 15-25 nests/ha | 2-3 young/nest | 75-85% | Mercury <1.0 ppm | Excellent |
| Agricultural Wetlands | 5-12 nests/ha | 1-2 young/nest | 60-70% | Elevated pesticides | Degraded |
| Industrial Areas | 0-5 nests/ha | 0-1 young/nest | <60% | Mercury >3.0 ppm | Critical |
| Coastal Estuaries | 10-20 nests/ha | 2-3 young/nest | 70-80% | Variable pollution | Good |
Case Studies: Herons as Environmental Detectives
The Chesapeake Bay Story
The Chesapeake Bay’s great blue heron populations have provided decades of environmental monitoring data. In the 1970s and 1980s, heron reproductive success plummeted in certain tributaries.
Investigation revealed mercury contamination from coal-fired power plants and industrial facilities. The herons detected the problem years before fish consumption advisories were issued for humans.
Subsequent pollution controls improved water quality. Heron reproductive success rebounded, confirming the effectiveness of remediation efforts.
“The herons told us when things were getting worse, and they confirmed when our cleanup efforts worked,” says Dr. Peter Osenton of the Waterbird Conservation for the Americas initiative. “They were monitoring we couldn’t afford to do any other way.”
Florida Everglades: Mercury Sentinel
The Florida Everglades faces ongoing mercury contamination from atmospheric deposition and historical agricultural practices. Great blue herons there accumulate some of the highest mercury levels documented in North America.
Studies by the U.S. Fish and Wildlife Service found that Everglades herons had blood mercury averaging 2.5-4.0 ppm—well above safe thresholds. This data helped prioritize mercury reduction efforts and informed public health advisories about fish consumption.
Researchers continue monitoring heron mercury levels as an indicator of Everglades restoration success.
Great Lakes Contamination Legacy
In the Great Lakes region, great blue herons revealed the extent of PCB and dioxin contamination decades after these chemicals were banned. Herons nesting near contaminated sediment sites showed:
- 40-60% reduction in hatching success
- Increased chick deformities
- Abnormal thyroid hormone levels
- Impaired immune function
This “legacy contamination” persists in sediments and continues affecting wildlife. Heron monitoring helps identify hotspots requiring remediation.
Case Study Comparison: Regional Contamination Impacts
| Region | Primary Contaminant | Heron Impact | Detection Timeline | Outcome |
| Chesapeake Bay | Mercury (coal plants) | Reproductive failure | Detected 5-7 years before human advisories | Cleanup validated by heron recovery |
| Florida Everglades | Mercury (atmospheric) | Blood levels 2.5-4.0 ppm | Ongoing monitoring since 1990s | Guides restoration priorities |
| Great Lakes | PCBs, dioxins | 40-60% hatching failure | Revealed legacy contamination | Identified remediation hotspots |
| California Central Valley | Pesticides (agriculture) | Eggshell thinning | Annual breeding surveys | Tracks agricultural runoff impacts |
Beyond Contamination: Herons and Habitat Quality
Great blue herons don’t just detect pollution—they also signal broader habitat health issues.
Wetland Connectivity
Herons require extensive foraging territories—often 1-3 hectares (2.5-7.4 acres) per bird. When wetland fragmentation isolates small patches, heron populations decline even if water quality remains good.
Landscape-scale studies show that rookeries persist longest in regions with >40% wetland coverage within a 5-kilometer (3.1-mile) radius. Below this threshold, colonies become unstable.
This information helps conservation planners prioritize wetland protection and restoration projects.
Prey Community Health
Because herons feed opportunistically on diverse prey—fish, amphibians, crustaceans, insects—their foraging success reflects overall aquatic biodiversity.
Herons struggling to find food in apparently healthy wetlands may indicate:
- Loss of prey diversity (even if total biomass seems adequate)
- Disrupted food web structure
- Invasive species displacing native prey
- Altered water flow or temperature regimes
The Cornell Lab of Ornithology’s eBird database documents that great blue heron presence correlates strongly with high-quality fish habitat across North America—providing a simple way to identify priority conservation areas.
Habitat Quality Thresholds for Heron Colonies
| Landscape Metric | Optimal | Adequate | Poor | Colony Stability |
| Wetland coverage (5 km radius) | >40% | 25-40% | <25% | Stable / Moderate / Unstable |
| Territory size per bird | 1-3 hectares | 3-5 hectares | >5 hectares | High prey / Moderate / Low prey density |
| Distance to human development | >300 m | 100-300 m | <100 m | Minimal disturbance / Moderate / High |
| Prey species diversity | >12 species | 6-12 species | <6 species | Excellent / Good / Poor ecosystem health |
Climate Change Indicators
Great blue herons are beginning to reveal climate impacts on wetland ecosystems:
Breeding phenology shifts: Northern populations now nest 7-12 days earlier than in the 1970s, tracking warmer spring temperatures.
Range expansion: Herons are nesting further north in Canada as climate warms, colonizing previously unsuitable habitats.
Drought sensitivity: During severe droughts, heron reproductive success plummets—even in otherwise healthy wetlands—as shallow feeding areas disappear.
Storm impacts: Increased hurricane intensity destroys coastal rookeries and forces population shifts. Heron distribution changes may predict future wetland vulnerability to extreme weather.
Dr. Sarah Mabey of the National Audubon Society notes: “Great blue herons are giving us real-time data on how climate change affects wetland ecosystems. We’re watching adaptation happen in real time.”
Climate Change Signals in Heron Populations
| Climate Indicator | Observed Change | Time Period | Ecological Meaning |
| Breeding timing | 7-12 days earlier | 1970s to present | Tracking warming spring temperatures |
| Northern range limit | Expanding northward | Past 30 years | Colonizing previously too-cold habitats |
| Drought response | Reproductive collapse | During extreme droughts | Signals wetland vulnerability |
| Hurricane impacts | Colony abandonment | Increasing frequency | Predicts storm-vulnerable areas |
| Migration patterns | Shortened distance | Past 20 years | Milder winters reduce migration need |
The Heron-Habitat Feedback Loop
The relationship between herons and wetlands isn’t one-directional. Herons both respond to and shape their ecosystems.
Nutrient Cycling
Colonial nesting herons deposit substantial guano beneath rookery trees. This concentrated nutrient input can:
- Enhance forest productivity (in moderate amounts)
- Alter understory plant communities
- Increase soil nitrogen and phosphorus by 200-500%
- Attract specialized insects and decomposers
In some rookeries, excessive guano eventually kills trees, forcing colony relocation. This creates a shifting mosaic of heron-modified habitats across the landscape.
Predation Pressure
By consuming fish and amphibians, herons regulate prey populations and may influence community structure. In systems where herons are abundant, they can:
- Reduce invasive fish populations (goldfish, carp)
- Control mosquito larvae through predation on aquatic insects
- Limit tadpole densities, potentially affecting algae growth
This predation role, while secondary to their value as bioindicators, adds to their ecological importance.
Heron Ecosystem Impact Summary
| Heron Activity | Direct Effect | Indirect Ecosystem Impact |
| Guano deposition | Nutrient concentration | 200-500% increase in soil N & P; altered plant communities |
| Fish predation | Controls prey populations | May limit invasive species; regulates prey community structure |
| Amphibian predation | Reduces tadpole density | Potential effects on algae and aquatic plants |
| Colony establishment | Tree mortality (from excess guano) | Creates shifting habitat mosaic across landscape |
| Foraging territory defense | Distributes predation pressure | Prevents localized prey depletion |
Quick Facts: Great Blue Heron as Bioindicator
| Feature | Value/Description |
| Bioindicator Type | Wetland health, water quality, contamination |
| Monitoring Advantages | High trophic position, long lifespan, site fidelity, visible colonies |
| Key Contaminants Detected | Mercury, pesticides, PCBs, heavy metals (lead, cadmium, selenium) |
| Safe Mercury Threshold | <1.0 ppm in blood or tissues |
| Reproductive Impairment Level | >3.0 ppm mercury |
| Optimal Territory Size | 1-3 hectares (2.5-7.4 acres) per bird |
| Landscape Requirement | >40% wetland coverage within 5 km (3.1 mi) for stable colonies |
| Climate Signal | Breeding 7-12 days earlier than 1970s baseline |
| Lifespan | 15-20 years (wild); up to 24 years recorded |
| Conservation Status | Least Concern (IUCN); regional populations vary |
Conservation Applications: Using Herons to Protect Wetlands
Recognition of great blue herons’ bioindicator value has led to practical conservation applications.
Regulatory Protection
Many jurisdictions now protect active heron rookeries with buffer zones—typically 100-300 meters (328-984 feet)—prohibiting development or disturbance during breeding season.
These protections benefit entire wetland ecosystems, not just herons. The buffer zones preserve water quality, shoreline vegetation, and habitat for numerous species.
Restoration Success Metrics
Wetland restoration projects increasingly use heron colonization as a measure of success. When herons establish rookeries in restored sites, managers know they’ve recreated functional habitat.
Restoration timelines vary: Some projects attract nesting herons within 3-5 years. Others take 10-15 years to develop suitable conditions.
Heron presence validates that water quality, prey populations, and habitat structure meet ecological standards.
Conservation Management Guidelines Based on Heron Monitoring
| Management Action | Trigger Indicator | Response Timeline | Expected Outcome |
| Establish buffer zones | Active rookery detected | Immediate (100-300 m radius) | Protects breeding habitat and water quality |
| Investigate contamination | Mercury >3.0 ppm or reproductive failure | Within 1 season | Identifies pollution sources for remediation |
| Assess habitat fragmentation | Colony instability or abandonment | 1-2 years | Guides wetland connectivity restoration |
| Validate restoration success | Heron colonization of restored wetland | 3-15 years post-restoration | Confirms functional ecosystem recovery |
| Climate adaptation planning | Breeding phenology shifts or range changes | Multi-year monitoring | Predicts future habitat requirements |
Public Engagement
Great blue herons’ visibility and charisma make them effective flagship species for wetland conservation. People connect emotionally with these graceful birds.
Conservation organizations leverage this appeal to build support for broader wetland protection—preserving ecosystems that support thousands of less visible species.
The Sentinel’s Message
Stand at the edge of any healthy wetland at dawn, and you’re likely to see a great blue heron. Perfectly still. Watching.
In that moment, the heron is doing more than hunting. It’s integrating years of environmental history into its tissues. It’s sampling water quality through the fish it consumes. It’s measuring ecosystem productivity through its reproductive success.
The heron carries within itself a record of everything the wetland has experienced—every contaminant, every drought, every flood, every gradual change in temperature or water chemistry.
When we learn to read the language of herons—population trends, nesting success, contaminant loads—we gain access to environmental information that would cost millions to obtain through conventional monitoring.
These patient fishers ask nothing of us except what any living creature deserves: clean water, abundant prey, and undisturbed space to raise their young.
In return, they offer something invaluable: early warning of environmental degradation. A chance to address problems before they become catastrophic. Evidence that our conservation efforts are working—or failing.
The great blue heron doesn’t just inhabit wetlands. It speaks for them. Every abandoned rookery is a cry for help. Every successful breeding season is a testament to health. Every bird standing sentinel at the water’s edge is an invitation to listen more carefully to what nature is telling us.
The question is not whether herons are reliable indicators. Decades of research have proven that they are.
The question is whether we’re paying attention to the warnings they’re sending.
Explore further: Discover the wider community of species that share the Everglades wetlands and influence heron survival.
Related insight: The recovery of other wetland birds like the osprey highlights how cleaner water benefits entire ecosystems.
References & Trusted Sources
- U.S. Geological Survey — Wildlife Toxicology Studies and Heron Biomonitoring Programs (usgs.gov)
- Smithsonian Environmental Research Center — Contaminant Research in Wading Birds (serc.si.edu)
- National Audubon Society — Great Blue Heron Conservation and Climate Watch Programs (audubon.org)
- U.S. Fish and Wildlife Service — Wetland Bioindicator Species and Mercury Studies (fws.gov)
- Waterbirds Journal — Peer-reviewed research on heron population dynamics (waterbirds.org)
Frequently Asked Questions
1. Why are great blue herons considered bioindicators?
Great blue herons occupy high positions in wetland food chains, accumulating contaminants from prey over their 15-20 year lifespans. Their health, reproduction, and population trends reliably reflect water quality, prey abundance, and overall ecosystem condition—often detecting problems years before other monitoring methods.
2. What contaminants do great blue herons detect most effectively?
Herons are particularly effective at detecting mercury, PCBs, pesticides, and heavy metals like lead and cadmium. These toxins bioaccumulate in fish and amphibians, then concentrate further in herons. Blood mercury levels above 3.0 ppm indicate contamination severe enough to impair reproduction.
3. How do scientists monitor great blue heron populations?
Researchers conduct annual rookery surveys counting active nests, monitor reproductive success by documenting fledged young per nest, collect blood and feather samples for contaminant analysis, and track long-term population trends through standardized census methods. Many studies span decades at the same sites.
4. Can great blue herons recover if wetland conditions improve?
Yes. When pollution is reduced or habitat quality improves, heron populations typically respond within 3-5 years. Chesapeake Bay herons rebounded after mercury controls were implemented, and restored wetlands often attract nesting colonies within a decade, confirming ecosystem recovery.
5. Do great blue herons only indicate pollution problems?
No. Herons also signal habitat fragmentation, prey depletion, drought stress, climate change impacts, and human disturbance. Their territory requirements (1-3 hectares per bird) and nesting colony stability reflect landscape-scale habitat quality beyond just water chemistry.
6. How do heron populations respond to climate change?
Great blue herons are nesting 7-12 days earlier than in the 1970s in response to warming springs. Their range is expanding northward in Canada. Extreme weather—hurricanes and droughts—increasingly impacts breeding success, making herons valuable indicators of climate effects on wetlands.
7. What mercury level is considered safe for great blue herons?
Blood or tissue mercury concentrations below 1.0 parts per million (ppm) are generally considered safe. Levels of 1.0-3.0 ppm indicate moderate contamination with potential sublethal effects. Above 3.0 ppm, reproductive impairment becomes likely, and above 5.0 ppm indicates severe toxicity.
8. How do abandoned heron rookeries help scientists?
When herons abandon previously active rookeries, it signals environmental degradation has occurred. Scientists investigate these sites to identify specific problems—contaminants, prey depletion, human disturbance—often discovering issues that would otherwise go unnoticed until more severe impacts appear.
9. Are great blue herons protected by environmental laws?
Yes. In the United States, great blue herons are protected under the Migratory Bird Treaty Act. Many states and localities provide additional protections for active rookeries, establishing buffer zones that restrict development and human activity during breeding season (typically March-August).
10. Can homeowners help monitor great blue herons?
Absolutely. Citizen scientists can report heron sightings to eBird, document rookery locations, photograph herons with visible bands for research tracking, and report unusual behaviors or apparent health problems to local wildlife agencies. Protecting backyard ponds and wetlands also supports local heron populations.